I. Overview II. US State Obesity Levels and Rankings, 2018 & 1990 III. US Obesity Maps Gallery
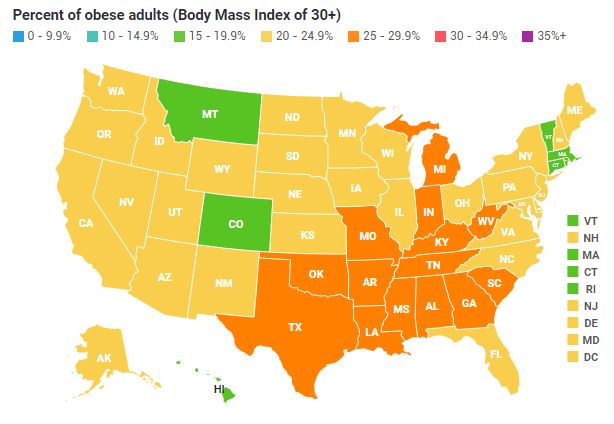
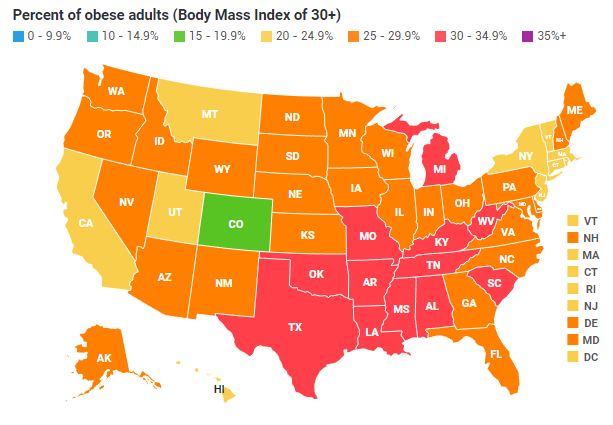
Obesity is usually determined by BMI (body mass index) measurements. Someone with a BMI of 30 or more is considered obese.
From 1990 to 2018, the average percentage of obese adults increased from 11.1% (for the 44 states and DC for which 1990 data are available) to 31.3%. According to the “State of Obesity” report by the Trust for America’s Health and the Robert Wood Johnson Foundation, as of 2018, nine states have obesity rates of 35% or higher; 22 states have obesity rates between 30% and 34.9%; 17 states have obesity rates between 25.0% and 29.9%; and two states and DC have obesity rates between 20% and 24.9%.
“The State of Obesity,” the source for the data below, used reports from the Centers for Disease Control’s (CDC) “Behavioral Risk Factor Surveillance System” (BRFSS) annual survey. The data for 1990 are incomplete because not all states participated in the survey that year.
II. US State Obesity Levels and Rankings, 2018 & 1990
| 2018 Rank | % of Population That Was Obese in 2018 | STATE | % Change from 1990 to 2018 | % of Population That Was Obese in 1990 | 1990 Rank |
|---|---|---|---|---|---|
| 39.6%* | Average | 182.0% | 11.1% (44 states & DC) | ||
| 1 | 39.5% | Mississippi | 163.3% | 15.0% | 1 |
| 1 | 39.5% | West Virginia | 188.3% | 13.7% | 4 |
| 3 | 37.1% | Arkansas | n/a | n/a | n/a |
| 4 | 36.8% | Louisiana | 199.2% | 12.3% | 10 |
| 5 | 36.6% | Kentucky | 188.2% | 12.7% | 9 |
| 6 | 36.2% | Alabama | 223.2% | 11.2% | 21 |
| 7 | 35.3% | Iowa | 189.3% | 12.2% | 11 |
| 8 | 35.1% | North Dakota | 202.6% | 11.6% | 15 |
| 9 | 35.0% | Missouri | 209.7% | 11.3% | 17 |
| 10 | 34.8% | Oklahoma | 237.9% | 10.3% | 31 |
| 10 | 34.8% | Texas | 225.2% | 10.7% | 26 |
| 12 | 34.4% | Kansas | n/a | n/a | n/a |
| 12 | 34.4% | Tennessee | 209.9% | 11.1% | 23 |
| 14 | 34.3% | South Carolina | 185.8% | 12.0% | 13 |
| 15 | 34.1% | Indiana | 156.4% | 13.3% | 6 |
| 15 | 34.1% | Nebraska | 201.8% | 11.3% | 17 |
| 17 | 34.0% | Ohio | 200.9% | 11.3% | 17 |
| 18 | 33.5% | Delaware | 132.6% | 14.4% | 2 |
| 19 | 33.0% | Mighigan | 150.0% | 13.2% | 8 |
| 19 | 33.0% | North Carolina | 148.1% | 13.3% | 6 |
| 21 | 32.5% | Georgia | 221.8% | 10.1% | 33 |
| 22 | 32.3% | New Mexico | 298.8% | 8.1% | 44 |
| 23 | 32.0% | Wisconsin | 171.2% | 11.8% | 14 |
| 24 | 31.8% | Illinois | 162.8% | 12.1% | 12 |
| 25 | 30.9% | Maryland | 186.1% | 10.8% | 25 |
| 25 | 30.9% | Pennsylvania | 125.5% | 13.7% | 4 |
| 27 | 30.7% | Florida | 169.3% | 11.4% | 16 |
| 28 | 30.4% | Maine | 178.9% | 10.9% | 24 |
| 28 | 30.4% | Virginia | 169.0% | 11.3% | 17 |
| 30 | 30.1% | Minnesota | 192.2% | 10.3% | 31 |
| 30 | 30.1% | South Dakota | 181.3% | 10.7% | 26 |
| 32 | 29.9% | Oregon | 167.0% | 11.2% | 21 |
| 33 | 29.6% | New Hampshire | 199.0% | 9.9% | 37 |
| 34 | 29.5% | Alaska | n/a | n/a | n/a |
| 34 | 29.5% | Arizona | 178.3% | 10.6% | 29 |
| 34 | 29.5% | Nevada | n/a | n/a | n/a |
| 37 | 29.0% | Wyoming | n/a | n/a | n/a |
| 38 | 28.7% | Washington | 184.2% | 10.1% | 33 |
| 39 | 28.4% | Idaho | 205.4% | 9.3% | 3 |
| 40 | 27.8% | Utah | 208.9% | 9.0% | 41 |
| 41 | 27.7% | Rhode Island | 174.3% | 10.1% | 33 |
| 42 | 27.6% | New York | 196.8% | 9.3% | 39 |
| 43 | 27.5% | Vermont | 157.0% | 10.7% | 26 |
| 44 | 27.4% | Connecticut | 163.5% | 10.4% | 30 |
| 45 | 26.9% | Montana | 220.2% | 8.4% | 43 |
| 46 | 25.8% | California | 160.6% | 9.9% | 37 |
| 47 | 25.7% | Massachusetts | 154.5% | 10.1% | 33 |
| 47 | 25.7% | New Jersey | n/a | n/a | n/a |
| 49 | 24.9% | Hawaii | 179.8% | 8.9% | 42 |
| 50 | 24.7% | DC | 71.5% | 14.4% | 2 |
| 51 | 23.0% | Colorado | 233.3% | 6.9% | 45 |
*The national obesity rates are higher than the state-by-state rates. According to the Sep. 2019 “The State of Obesity: Better Policies for a Healthier America” report, the obesity rates from each state as reported by the “Behavioral Risk Factor Surveillance System” (BRFSS) are calculated with self-reported height and weight from each respondent. Because people tend to overestimate their own height and underestimate their own weight, the BRFSS may underestimate obesity rates by nearly 10 percent. Because of that discrepancy, the State of Obesity report used a national estimate from the National Health and Nutrition Examination Survey (NHANES), which bases the national obesity rate on physical examinations of respondents rather than self-reported height and weight.
(click each map to enlarge)
 |  |  |
 |  |  |
 |  |  |
 |  |  |
 2012 |  |  |
 |  |  |
 |
IV. Source
State of Obesity, “Obesity Rates: Adults,” stateofchildhoodobesity.org, Sep. 2019
Trust for America’s Health and the Robert Wood Johnson Foundation, “The State of Obesity: Better Policies for a Healthier America,” stateofobesity.org, Sep. 2019


| More to Explore |
|---|
| Should Chocolate Milk Be Available in Schools? |
| Calories Burned During Activities |
| International Meat Consumption |